Inconsistent SKU databases, users refusing location tracking, and organisational silos between marketing and retail operations.
- WowMedia&Metrics
- Marketing
- The ROPO Effect in Practice – how do you track and monetise the Research Online, Purchase Offline journey?
The ROPO Effect in Practice – how do you track and monetise the Research Online, Purchase Offline journey?
- Last update: 27/04/2025
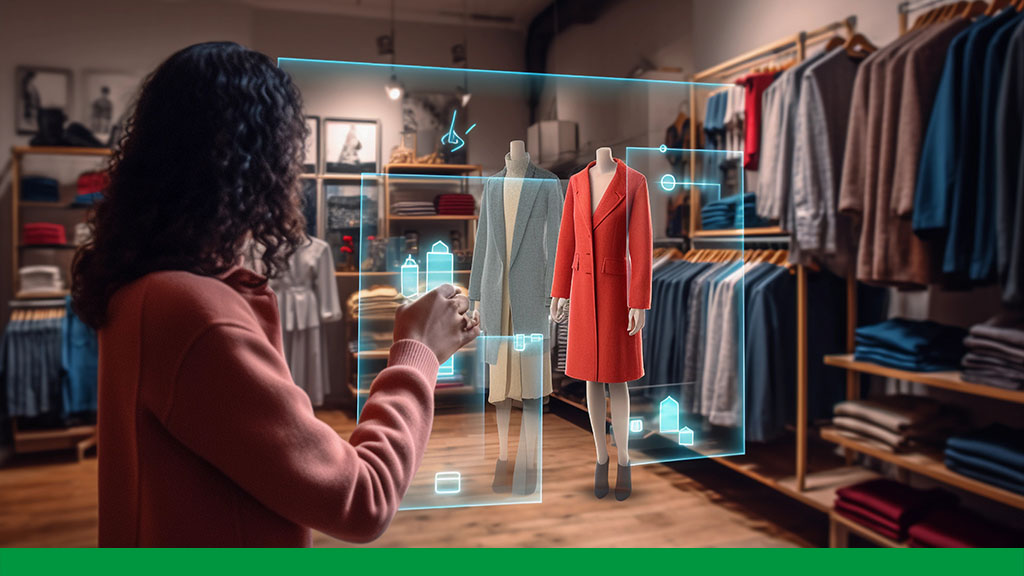
Table of contents:
What is the ROPO effect in Poland (Research Online, Purchase Offline) and why is it growing in importance?
Definition and B2C examples
The ROPO effect in Poland describes a customer journey in which shoppers research products on-line and then complete the purchase in a bricks-and-mortar store. During the research phase, reviews, comparison sites and expert articles carry the greatest weight.
- Consumer electronics: a customer compares the specifications of a television on-line, then visits a showroom to judge picture quality in person and speak to a sales adviser.
- DIY: a homeowner weighs up power-tool features on the web but only makes the final decision after picking up the drill in a builders’ merchant.
The phenomenon also works in reverse: so-called reverse ROPO in Poland occurs when a shopper studies an item in store and later orders it on-line. Brands that recognise both directions of the process can plan their marketing spend more intelligently and optimise ROI.
Purchasing trends – mobile first and showrooming
The smartphone has become the primary source of price and availability information, so a mobile-first web presence is now non-negotiable. Pages that load quickly, offer easy filtering and display real-time stock levels encourage users to move from desk research to an in-store visit.
At the same time, showrooming is on the rise: shoppers test products physically but place the eventual order wherever the price is keenest. Transparent pricing, clearly communicated promotions and hassle-free returns are therefore essential.
Marketers deploy geo-targeted ads and push notifications to capture shoppers at the decisive moment. Well-timed remarketing reminds users of products viewed on-line and steers them towards the nearest outlet, reinforcing a mobile marketing strategy in Poland.
The cost-of-living squeeze and offline decision-making
Rising energy bills and everyday costs mean buyers scrutinise every purchase. The ROPO effect in Poland helps them compare multiple offers before parting with cash. People want to see and handle the goods, convinced that the in-store price matches the promised quality. Physical retailers can satisfy that need by adding services such as free set-up or extended warranties. Clear on-line pricing and local stock indicators reduce frustration and lower the perceived risk at the till.
For marketers this demands granular keyword tracking – phrases such as “Bosch drill price shop Warsaw” reveal high-intent searches. Feeding point-of-sale (POS) takings back into on-line analytics attributes revenue to specific campaigns, letting firms judge profitability and react quickly to shifting consumer behaviour.
Blending the informational power of digital with the tactile assurance of the high street builds trust and steadier sales. In a tightening economy, mastering the ROPO effect – and its reverse – through consistent omnichannel marketing is becoming a decisive competitive advantage.
The ROPO effect occurs when consumers look for product information on-line and then complete the purchase in a physical shop.
WowMedia&Metrics
The four pillars of measuring ROPO
Tagging & UTM parameters – linking campaigns to store visits
Consistent link-tagging is the first line of defence against data chaos. UTM parameters assign every on-line session to a specific campaign and creative. When the customer, having done their research, walks into a shop, your analytics platform can connect that visit with the earlier click.
Use a clear convention – utm_source, utm_medium, utm_campaign, plus an extra field such as utm_store. Reports then show which activities drove off-line footfall and at what cost. Precise tagging is the bedrock of measuring the ROPO effect in Poland; without it, determining the impact of advertising (or comparing ROPO with reverse ROPO across channels) is almost impossible.
Store-Visit Conversions in Google Ads – tech requirements & volume thresholds
Automatic Store-Visit conversions form the second pillar. They work once you pass Google’s minimum-click threshold and have a fully verified location in Google Business Profile.
Google combines GPS and Wi-Fi signals with Location History (if users have it enabled) to model visits and attribute them to ad campaigns. Most stores need tens of thousands of monthly clicks to achieve statistical reliability.
Because Smart Bidding can optimise for real store visits rather than clicks alone, this metric is essential to gauge the overall Research Online, Purchase Offline effect in Poland across an entire retail network.
Importing POS transactions into Google Analytics 4 – SKU & customer-ID mapping
The third pillar is integrating your point-of-sale data with GA4. Export in CSV or via API (services such as Make.com help). Each record should include the transaction ID, timestamp, basket value, product SKU and a unique customer identifier (e.g. loyalty-card number).
Send an offline_purchase event to GA4 with matching parameters. GA4 then ties the store sale back to earlier on-line activity using the device ID or captured e-mail, giving you the full ROPO in Poland journey and true cost-of-revenue for bricks-and-mortar sales.
Surveys & QR codes – validating data at the till
Even the slickest tracking needs ground-truth checks. Short till-point surveys or QR codes on receipts allow you to confirm how the customer heard about the offer. If they cite search or social ads, you reinforce the analytics data; the QR can carry a one-off voucher as an extra incentive.
Matching customer declarations with system data uncovers discrepancies and bolsters attribution credibility, giving you dependable numbers for campaign optimisation and pricing decisions.
Integrating all four pillars delivers a complete picture of purchasing behaviour. Marketers can pinpoint the strength of the ROPO effect in Poland, see which channels sway customers most, and deploy budgets more efficiently – creating a seamless, measurable alignment between on-line and off-line activity.
Integrated ROPO in Poland reporting dashboards
Looker Studio & BigQuery – the data architecture
To measure the efekt ROPO in Poland properly you first need a shared home for on-line and off-line data.
- BigQuery houses the full data sets – clicks, store visits and POS takings – so you can tie campaign events to till receipts and product SKUs.
- Looker Studio, via its native BigQuery connectors, displays the numbers almost in real time. Interactive filters let managers see at a glance which Google Ads or Meta Ads campaigns are driving the heaviest footfall.
Because the warehouse sits underneath, reports stay fast even with millions of rows. Budget calls are therefore rooted in hard evidence rather than hunches, reinforcing every strand of digital marketing.
KPIs that matter when judging the ROPO in Poland effect
The first key metric is off-line ROAS – revenue generated in bricks-and-mortar stores divided by on-line click spend. It focuses on real profit, not just web traffic.
Second comes the share of sales assisted by on-line research within total store turnover – the proportion of receipts preceded by a web search.
Add to that the average ROPO basket value, items per transaction and gross margin. During promotions the crucial gauge is the gap between list price and the final till price – a window onto consumers’ discount sensitivity. Together these KPIs reveal both the scale of the ROPO in Poland phenomenon and the levers for price or creative optimisation.
Segmentation by source and campaign
A single data matrix allows razor-sharp segmentation. Best practice is to group reports by utm_source, utm_medium and utm_campaign. Looker Studio shows results in pivot-style tables: one row per campaign, columns for store visits, off-line transactions and off-line ROAS. Extra dimensions – device type or shop location – surface differences between cities or trading hours, making later tweaks to the media plan for Poland far easier.
The “reverse ROPO in Poland” segment – an on-line purchase after a physical shop visit – is built by filtering e-commerce sales that have a prior off-line session. Comparing the two segments helps balance spend across channels and prevents sales cannibalisation.
Why a single view matters
A unified dashboard slashes report prep from days to minutes. Senior management gains full visibility of customer-acquisition cost and profit per visit. The performance marketing team can spot low-yield campaigns and adjust before budgets drain away. Pricing analysts see instantly whether store-to-site price gaps drag down conversion. Constant data-led decisions mean sharper, more effective action.
Roll-out in four steps
| Stage | Description |
|---|---|
| (1) Data export | Data such as clicks, store visits and till receipts are pushed to BigQuery every day. |
| (2) Looker Studio model | We parameterise sources and goals, creating definitions for the key performance indicators (KPIs). |
| (3) Refresh automation | Schedules are set so the report refreshes within the required timeframe. |
| (4) Validation | We compare the dashboard figures with the till report to confirm their reliability. |
Such a set-up lets the company track sales in real time, measure the efekt ROPO in Poland with pin-point accuracy, and react swiftly to shifts in customer behaviour. By combining Looker Studio with BigQuery you elevate reporting to a whole new level, unlocking the full value of data from every sales channel.
How do you turn the efekt ROPO in Poland into real profit?
An attribution model that factors-in offline sales
The starting-point is to allocate part of your bricks-and-mortar revenue to earlier online interactions. In practice we use a hybrid, data-driven model topped-up with a ‘store-weight’ coefficient that expresses the influence of digital touch-points on the final purchase.
Example: path analysis shows that 60 per cent of shoppers click a Google Ads placement before walking into the shop, while the remaining 40 per cent buy without going online at all. We therefore assign 0.6 of the till receipt to the campaign. That prevents double counting, and lets you compare the standard ROPO in Poland with its mirror image – the reverse ROPO, where turnover is attributed to the e-commerce channel. The coefficient is reviewed regularly on the basis of till-point surveys and Google Ads Store-Visit Conversion data.
ROI worksheet – calculation flow
A straightforward spreadsheet is enough for a quick dip-check. Set up the columns as follows:
Campaign / source – taken straight from
utm_campaign.Ad spend (PLN) – total digital media cost.
Offline gross revenue (PLN) – value pulled from the POS system.
Offline weight (%) – agreed ‘store-weight’ coefficient.
Attributed revenue (PLN) = Offline revenue × Offline weight.
Offline ROAS = Attributed revenue ÷ Ad spend.
ROI (%) = (Attributed revenue − Ad spend) ÷ Ad spend × 100.
These formulae instantly flag campaigns that are losing money – or delivering the healthiest return. A more advanced sheet can add margin, number of new customers and average basket value. You can also drop in product segments to see, for instance, whether price promotions attract higher-value footfall. Feed the sheet automatically from BigQuery or upload POS reports manually, and the marketing team can view click-cost and real profit in one place.
By marrying the attribution model with an ROI spreadsheet you turn analysis of the ROPO in Poland into a hard-nosed financial tool – sharpening budget decisions and squeezing maximum value from every zloty spent online.
Barriers and pitfalls in implementing the efekt ROPO in Poland
Discrepancies in the SKU database
Accurate measurement of the ROPO in Poland effect rests on a single, consistent product feed. When the SKU list on the e-commerce site differs from the POS catalogue, the algorithms cannot link online research with offline purchases. Inevitably, the share of store revenue supported by online activity is understated and campaign profitability is mis-read.
Typical causes include:
local naming conventions
out-of-date pricing
or duplicated SKU numbers
A practical fix is a central product-information system that synchronises codes, descriptions and stock levels across all channels. During the rollout of new ranges it is worth running an additional manual audit to catch any mismatches early.
Lack of consent for location tracking
Store-visit modelling is powered by GPS signals from mobile devices. If shoppers decline location sharing, the proportion of detected visits plunges and the ROPO report understates the impact of online campaigns on footfall. Clear, up-front messaging—‘Share your location and we’ll show stock in your nearest branch’—boosts opt-in rates.
Complementary validation methods, such as QR codes on in-store displays, can also confirm cross-channel engagement.
Organisational silos: marketing versus sales
Even the slickest data model fails if teams refuse to share information. Performance marketers pore over clicks and media spend, while the sales floor obsesses about receipts and margin. Without common metrics of customer value, neither the efekt ROPO in Poland nor its reverse variant can be settled accurately.
A remedy is an omnichannel task-force that agrees a single revenue source of truth. Shared dashboards and KPIs—offline ROAS, average ROPO basket value—align departmental goals and defuse turf wars.
Removing these barriers is essential if the ROPO in Poland metric is to mirror genuine consumer behaviour. Only then can a brand scale budgets with confidence, optimise pricing, and act on verified evidence of how online campaigns drive store sales.
Conclusions & recommendations
Implementation checklist
| Task | Description |
|---|---|
| Synchronise SKU databases | An organised online and offline catalogue minimises errors in reports on the ROPO effect in Poland. |
| Standardise UTM parameters | Consistent campaign names shorten analysis time and remove gaps in the data. |
| Enable Store Visit Conversion | Check that branches meet the traffic minima required by Google Ads. |
| Import till receipts into GA4 | Configure the offline_purchase event, adding the client ID and basket value. |
| Build a dashboard in Looker Studio | Collect data hourly and refresh the offline ROAS KPI. |
| Define the offline weight | Agree with the retail team what percentage of revenue should be attributed to online channels. |
| Segment campaigns | Compare ROPO and reverse ROPO in Poland by traffic source and product category. |
| Validate results at the till | A short survey or QR code will confirm that consumers actually saw the advert. |
| Eliminate silos | Set shared KPIs for marketing and sales. |
| Optimise | Update the offline weight, prices and creatives monthly in line with fresh data. |
Zero-party data and loyalty building
Consumers are increasingly willing to share information voluntarily—provided they see a clear benefit. Zero-party data such as preferred size, colour or price range lets brands personalise offers and sharpen remarketing. With this declarative insight you can predict which products shoppers will want to examine in-store. A timely alert that a specific model is in stock at their chosen branch cuts wasted visits and lifts the offline conversion rate.
Collecting zero-party data hinges on a compelling value exchange: early access to launches, a personal discount or similar perk. Merging these declared preferences with online behaviour creates higher-margin loyalty segments, shortens the path to purchase and boosts customer lifetime value.
By sticking rigidly to the checklist—and by exploiting zero-party data with finesse—you make the efekt ROPO in Poland both measurable and scalable. The phenomenon stops being an elusive quirk of consumer behaviour and becomes a solid lever for growth.
ROPO glossary
| Term | Definition |
|---|---|
| ROPO (in Poland) | Research Online Purchase Offline – the process in which a consumer researches a product on the internet and then completes the purchase in a bricks-and-mortar shop. |
| Reverse ROPO (in Poland) | The opposite of ROPO: the customer views the product in a physical store but ultimately buys it online. |
| Store Visit Conversion | An automatic Google Ads conversion that estimates in-store visits resulting from an online ad interaction. |
| BigQuery | Google’s cloud data warehouse used to store and analyse large omnichannel datasets. |
| Looker Studio | A data-visualisation tool that connects to BigQuery and builds ROPO dashboards. |
| UTM | URL parameters that identify the source, medium and campaign in analytics reports. |
| SKU | Stock Keeping Unit – a unique product code essential for mapping offline sales to online campaigns. |
| Store Weight | A coefficient that indicates what share of offline revenue should be attributed to online interactions in an attribution model. |
| Zero-party data | Information voluntarily provided by the user (e.g. preferred colours, budget), useful for personalising ROPO journeys. |
| Geotargeting | Serving adverts based on a user’s current or recent location, often used to drive footfall to stores. |
| Showrooming | The practice of testing a product in-store while searching for a cheaper offer online. |
| Smart Bidding | A Google Ads algorithm that automatically adjusts bids to goals such as in-store visits or offline ROAS. |
FAQ – the efekt ROPO in Poland in practice
What does ROPO stand for?
ROPO (Research Online Purchase Offline) is the pattern in which a shopper gathers information and compares prices on-line, then completes the purchase in a bricks-and-mortar store.
How does ROPO differ from reverse ROPO?
With ROPO, the research happens on-line and the transaction off-line. In reverse ROPO, the customer inspects the product in-store but buys it later via e-commerce.
Which data are essential for measuring the ROPO effect?
You need campaign clicks, Store Visit data, POS receipts and a consistent SKU catalogue across on-line and off-line channels.
Does Store Visit Conversion work in every sector?
No. Google Ads requires a minimum click volume and verified locations. Smaller retailers can fall back on in-store QR codes or till-point surveys.
How do I attribute off-line revenue to on-line campaigns?
Use an attribution model with an off-line weight—e.g. assign 60 % of the till receipt’s value to the channel that preceded the shop visit.
Which analytics tools handle ROPO data best?
BigQuery stores the omnichannel logs, while Looker Studio visualises KPIs such as off-line ROAS or the share of sales assisted by on-line research.
What most often hinders ROPO implementation?
How does zero-party data support a ROPO strategy?
Voluntary information from customers lets you send alerts about a specific model’s availability in the nearest branch, boosting off-line conversion.
How quickly will we see results after implementation?
Initial insights emerge four to six weeks after integrating POS with analytics. Full budget optimisation usually takes a few reporting cycles.
We are the media agency of the AI generation.
We support businesses with ATL and Digital media services. We leverage leading AI engines and Customer Journey modelling. We deliver effective and efficient advertising communication.
Tags: ropo and reverse ropo | ropo effect | ropo in poland
Share: